品牌
*注:按产品型号,可检索常见问答、样本、证书等信息。


Web Server for Energy Efficiency 订购编号:
点击这里发送询价请详细填写一下内容,包括产品原产国、品牌完整名称以及您所能得到的所有信息,这将有助于我们准确迅速的报价。非常感谢!
Web Server for Energy Efficiency
Management and Control Software Energy Sentinel Web
Related Products

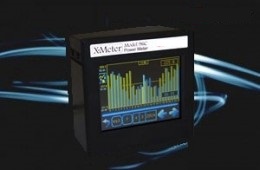
Network analyzer 96c (X-Meter 96c)

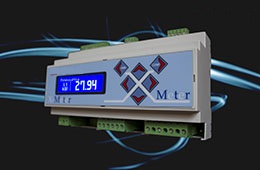
Multifunction network analyzer for Rogowski probes (X-Meter DIN Rogowski)

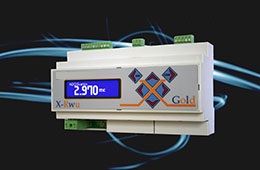
Datalogger (X-RWU Gold)
Your Energy Data, when and where you Want.
On line everywhere in simple way
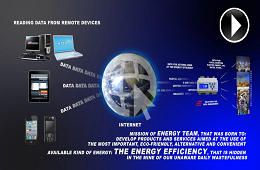
Energy Sentinel WEB is an application Server which allows you to get an access via remote to acquired data and to analyze them, through simple and intuitive WEB pages. The use of this WEB application on a Server makes possible the best security concerning the availability and reliability of the system, allowing also a plant control to the highest performance of energy efficiency (KPI).
Our SW is in constantly evolving, with frequent updates adding new features to the platform. Its flexibility and potential are attested by thousands of our customers using this kind of solution. The dealing with the software with every kind of instrument, meter or device, allows you to avoid HW replacement in existing plants. With a wide measurement range (voltage, radiation, energy consumptions etc..), it covers several application fields: from small industry to administrative offices, from big warehouses to big industries. ISO 50001 certified companies, system integrators, energy managers, energy consulting firms and ESCO can take significant advantages by using the platform. Despite the SW’s high range of settings and configurations, it remains intuitive and lets you meet with complex requirements such as real time or historical data display, activities or alarms management, fully customizable synoptic or monthly reports.
The software, was born to be multi-user and multi-site, and it allows the following functions:
-
- Displaying data on the Web, using the standard http protocol through any browser (Explorer, Chrome, Safari, Firefox). Possibility to enable the encryption of the connection through https protocol
- Checking the stored data by accessing anytime through any Web point, thanks to User-ID and a Password, without installing additional programs
- Configuring entirely the access to data on the Web, setting for each user the access mode to various areas
- Manage the data from many devices geographically far from each other.
- The platform versatility allows you to integrate devices and instruments “from third people” by means of their system protocol.
- The Consultation Interface is also optimized for I-pad and Tablet.
Through its graphical interface, simple and intuitive, it’s also possible to:
-
- Realize and compare graphics, histograms and diagrams
- Advanced data displaying with graphics such as Carpet Plot, Scatter Plot and Periods Comparison
- Compare data with different full-scale among them
- Customizable Dashboard
- Reports creation with the possibility of sending automatic emails
- Create of mathematical modules to open virtual channels
- Display fully configurable real-time data
- Display fully configurable graphics
- Display summaries of period
- Share of the consumptions in bands
- Set the type of fields you want to see: histograms, linear graphics, flow charts, etc.
- Display historical data on a freely-selectable time interval, as a line graphic or column diagram, showed with two vertical axes
- Arrange data in tables
- Export data as CSV format for Excel
- Set and create groups and subgroups for data coming from the controlled plants (unlimited number of levels)
- Set alarm thresholds, with possibility to send SMS and e-mail if the threshold values set are exceeded
- Set and display of the tariff
- Alarms on closing and opening contacts and thresholds with hysteresis


